This study adopts a comparative qualitative approach to analyze the classification and forecasting systems used for hurricanes and tropical cyclones across different regions. The methodology is structured into two main components: classification systems and forecasting tracking technology.
Hurricanes are classified mainly by their maximum sustained wind speeds, measured at a standard height of 10 meters over open terrain.
Wind Scale divides hurricanes into five categories. Each category reflects increasing wind speeds and associated damage levels (Table 1).
This scale focuses only on wind speed and does not account for storm surge, rainfall, or size. For example, a Category 5 hurricane with winds of 157+ mph includes both storms like Hurricane Katrina and much smaller, less impactful storms with the same wind speed making this a limitation of the scale.
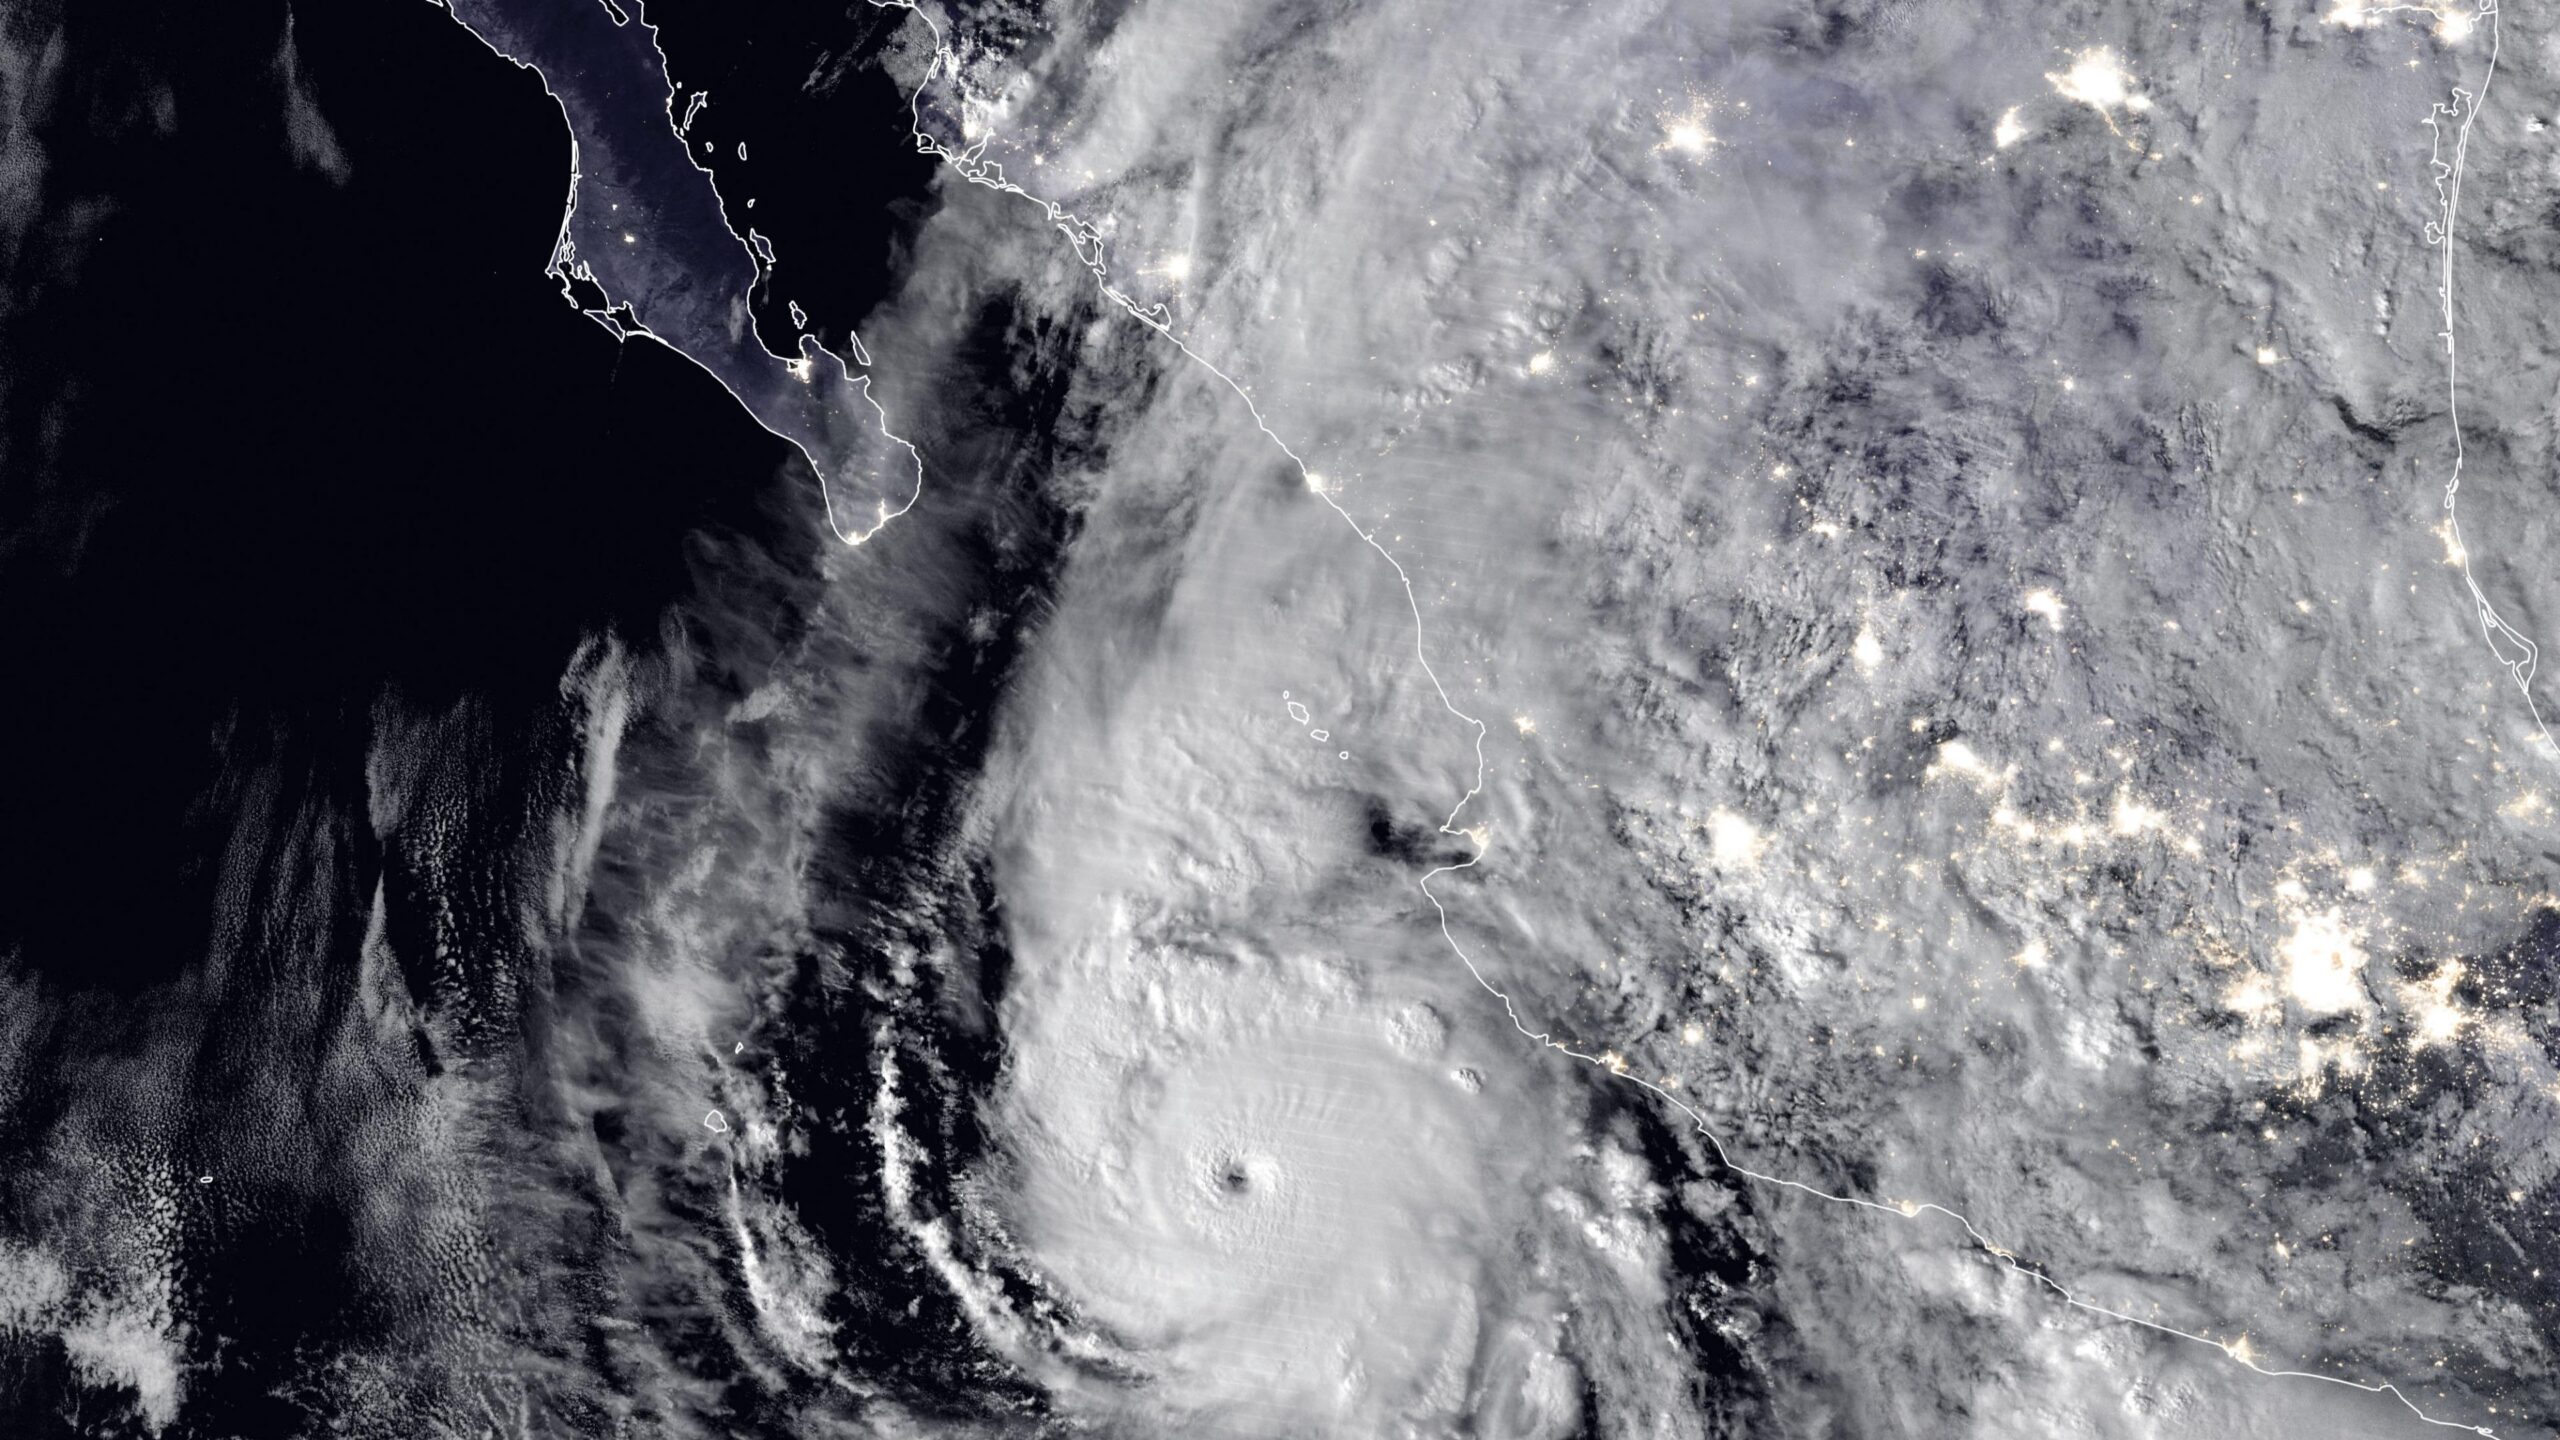
Table 1: Saffir-Simpson Hurricane Wind Scale
Category | Sustained Winds (mph) | Damage Description |
|---|---|---|
1 | 74-95 | Some damage to roofs, siding, trees; power outages likely |
2 | 96-110 | Extensive roof and siding damage; many trees uprooted; long power outages |
3 (major) | 111-129 | Major roof damage; many trees down; utilities unavailable for days to weeks |
4 (major) | 130-156 | Severe damage with loss of most roof structure; area uninhabitable for weeks/months |
5 (major) | ≥157 | Most framed homes destroyed; widespread power loss; area uninhabitable for weeks/months |
Table 2: Classification of Tropical Cyclones by Wind Speed (JMA Scale)
Category | Sustained Winds (knots) | Approx. km/h |
|---|---|---|
Tropical depression | ≤33 | ≤61 |
Tropical storm | 34–47 | 62–88 |
Severe tropical storm | 48–63 | 89–117 |
Typhoon | ≥64 | ≥118 |
Very strong typhoon | 85–104 | 157–193 |
Violent typhoon | ≥105 | ≥194 |
In the Western Pacific, tropical cyclones are classified using the Japan Meteorological Agency (JMA) scale, which is based on 10-minute sustained wind speeds. As shown in Table 2, storms are categorized into:
The United States Joint Typhoon Warning Center (JTWC) uses a similar scale but based on 1-minute average wind speeds, more comparable to the Saffir-Simpson scale. According to JTWC, a super typhoon has sustained winds over 130 knots.
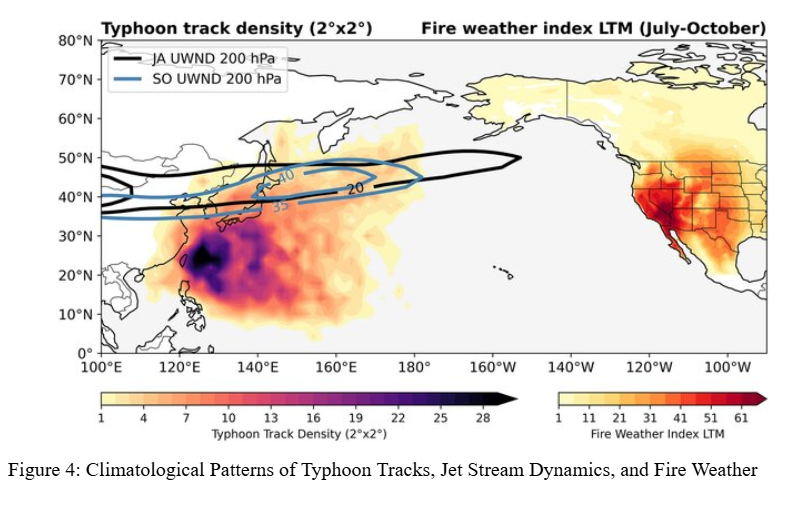
Figure 4 shows typhoon track density and the connection between jet stream winds and fire weather risk in North America. The dark shaded areas in the Western Pacific indicate regions with high typhoon activity. The black lines show average jet stream paths that can carry storm energy across the Pacific, potentially influencing weather patterns and fire risks in the western United States.
In the North Indian Ocean, the India Meteorological Department (IMD) uses a 7-category scale to classify tropical cyclones based on 3-minute sustained wind speeds. This scale ranges from: Depression (17–33 knots) to Super Cyclonic Storm (≥120 knots).
Using 3-minute averages provides smoother and more accurate estimates of storm intensity compared to other scales like the Saffir-Simpson scale. The IMD developed this system based on regional data to better reflect the behavior and impact of cyclones in the Indian Ocean.
This classification helps improve the accuracy of forecasts and allows warnings to be tailored to storm severity. For instance, the 1999 Super Cyclonic Storm Orissa maintained its intensity for over 30 hours after landfall highlighting the importance of distinguishing between storm categories for effective response. Accurate classification ensures that people receive the right level of warning, which can be life-saving in vulnerable regions (Bhowmik et al., 2005; Leroux et al., 2018).
Category | Sustained Winds (knots) | Description |
|---|---|---|
1 | 34–47 | Tropical cyclone |
2 | 48–63 | Tropical cyclone |
3 | 64–85 | Severe tropical cyclone |
4 | 86–110 | Severe tropical cyclone |
5 | ≥108 | Severe tropical cyclone |
Table 3: Classification of Tropical Cyclones by Sustained Wind Speed
In the Southern Hemisphere, countries like Australia and regions like the South-West Indian Ocean (monitored by Météo-France) use a 5-category tropical cyclone intensity scale based on 10-minute sustained wind speeds. This system is similar to the Saffir–Simpson scale but adapted for regional conditions.
As shown in Table 3, cyclones are classified into five categories:
This classification helps identify the difference between regular tropical cyclones and more dangerous, severe storms. However, the category labels may not clearly explain the potential damage or risk, and could benefit from more detailed descriptions.
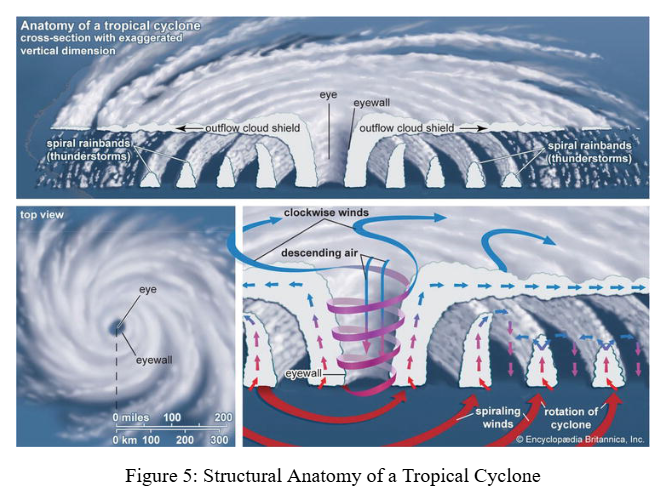
Figure 5 shows the structure of a tropical cyclone, both from the side and top views. Key features like the eye, eyewall, spiral rainbands, and outflow cloud shield are illustrated. The diagram also highlights the vertical movement of air, storm rotation, and the role of towering convection, which drives the cyclone’s energy and circulation.
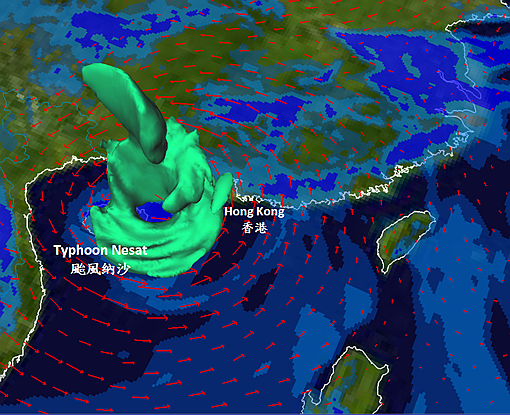
Since 2009, Hong Kong has followed the World Meteorological Organization (WMO) guidelines for naming and classifying tropical cyclones. It uses 10-minute average sustained wind speeds to determine storm intensity making it the only place in the world to apply this measurement specifically for classification (Table 4).
The Hong Kong Observatory (HKO) categorizes tropical cyclones as follows:
Other East Asian agencies, like the Japan Meteorological Agency (JMA) and China Meteorological Administration (CMA), use similar localized systems. For example, the JMA defines typhoons as “very strong” at 44–54 m/s and “violent” above 54 m/s.
Table 4: Presentation of Hong Kong Tropical Cyclone Classification Scale
Tropical Cyclone Classification | Maximum Sustained Winds Near the Center (km/h) |
Tropical Depression (TD) | < 63 |
Tropical Storm (TS) | 63 – 87 |
Severe Tropical Storm (STS) | 88 – 117 |
Typhoon (T) | 118 – 149 |
Severe Typhoon (ST) | 150 – 184 |
Super Typhoon (SuperT) | ≥ 185 |
Key differences among classification systems: Table 5 summarizes key differences in tropical cyclone classification systems used by various agencies. These differences are mainly in the wind averaging periods and classification thresholds. For instance, while the Saffir-Simpson Scale is globally recognized, it lacks regional specificity. Regional systems used by agencies such as JMA, IMD, and HKO offer more localized and detailed classifications that better reflect regional hazards and forecasting needs.
Table 5: Cyclone Classification Systems by Region or Agency
Region/Agency | Wind Measurement | Categories | Notable Feature |
Saffir-Simpson Scale (NHC, Atlantic & E. Pacific) | 1-minute sustained | Category 1 to 5 (based on wind speed) | Used internationally, focuses on wind only |
Japan Meteorological Agency (JMA) | 10-minute sustained | Tropical Storm, Typhoon, Very Strong Typhoon, Violent Typhoon | Regional use, refined categories for strong typhoons |
Joint Typhoon Warning Center (JTWC) | 1-minute sustained | Tropical Depression, Tropical Storm, Typhoon, Super Typhoon (≥130 kt) | US military standard, uses higher resolution wind |
India Meteorological Department (IMD) | 3-minute sustained | 7 categories: Depression to Super Cyclonic Storm | Granular for Indian Ocean; uses 3-minute average |
Hong Kong Observatory (HKO) | 10-minute sustained | 6 categories: TD to Super Typhoon | Tailored to local risk, matches WMO standards |
Australia / Météo-France (SW Indian Ocean) | 10-minute sustained | Category 1 to 5 (different thresholds than Saffir-Simpson) | Similar structure to SSHS but with adjusted thresholds |
To assess how storms are predicted and monitored, the study analyzed advanced technological tools used in hurricane tracking and forecasting:
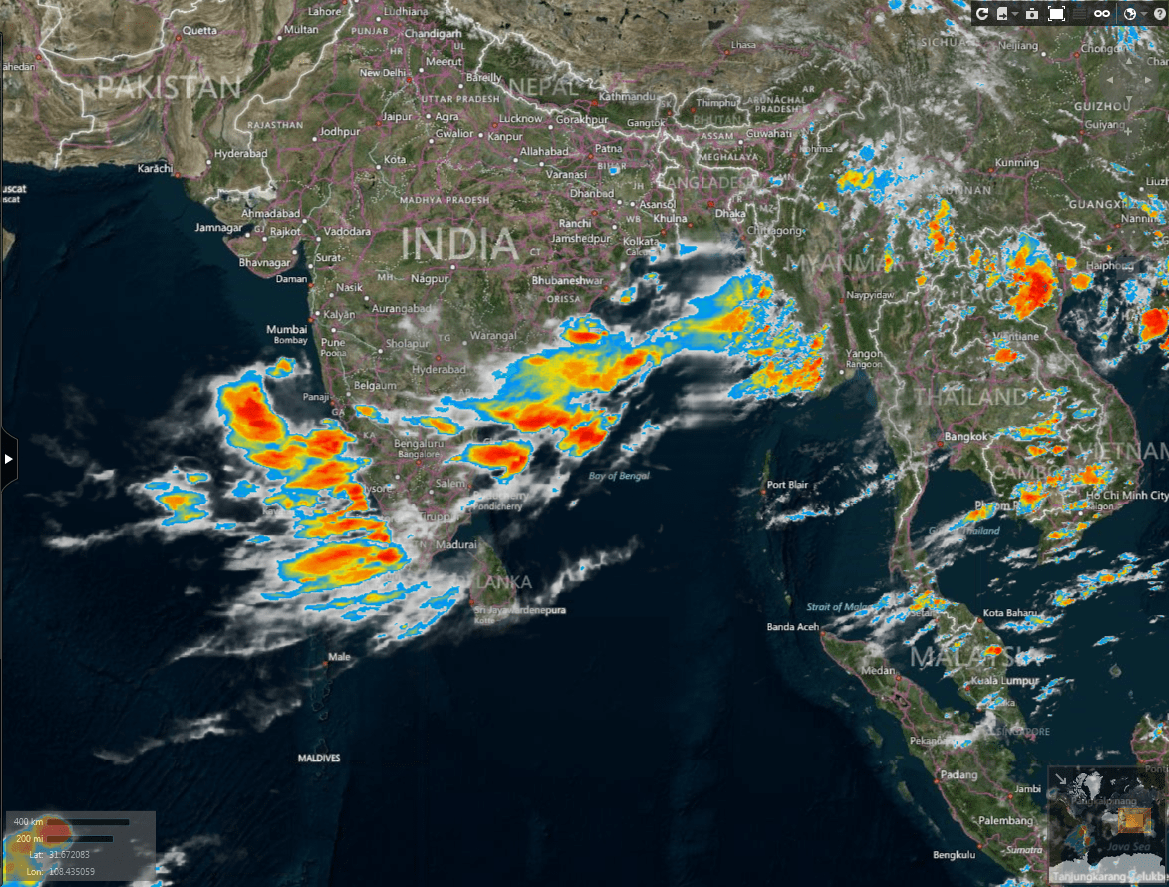
Hurricanes can be effectively monitored using satellite imagery and radar systems, which provide continuous and high-resolution data for early warnings and real-time tracking. Geostationary satellites deliver near-continuous cloud coverage, allowing for the observation of hurricane development, intensity, and movement. Multispectral and radar sensors—such as Landsat TM, RADARSAT-1, and WorldView-2—are valuable for post-storm analysis, helping identify damage to buildings, changes in coastal areas, and loss of vegetation, as observed in hurricanes like Katrina and Irma (Barnes et al., 2007; McCarthy et al., 2020; Ramsey et al., 2009).
In addition, Interferometric Synthetic Aperture Radar (InSAR) and its derivatives (DInSAR and PS-InSAR) are used to study ground deformation and moisture content, providing further insight into hurricane-related impacts (Byrraju et al., 2020).
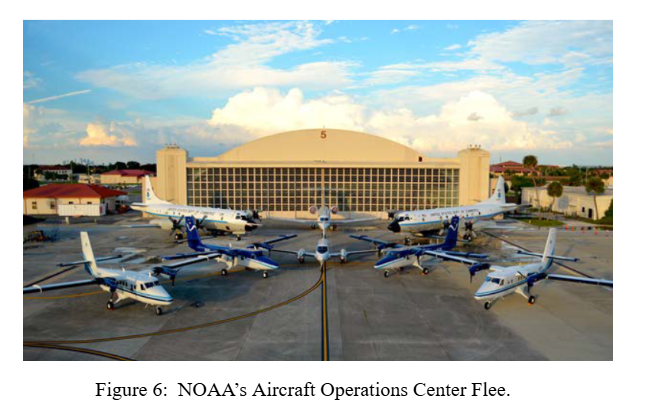
Aircraft reconnaissance plays a key role in tracking hurricanes, especially when satellite images are limited by cloud cover. Specialized planes, known as “Hurricane Hunters,” are operated by NOAA and the U.S. Air Force Reserve to fly directly into storms and collect real-time data. These aircraft, such as the WP-3D Orion and Gulfstream G-IV, are equipped with advanced instruments including GPS dropsondes and Doppler radar. They measure wind speed, air pressure, humidity, and temperature at different levels inside the storm, as well as the 3D wind structure and atmospheric profiles. The data helps improve forecast models, update storm paths, and verify predictions.
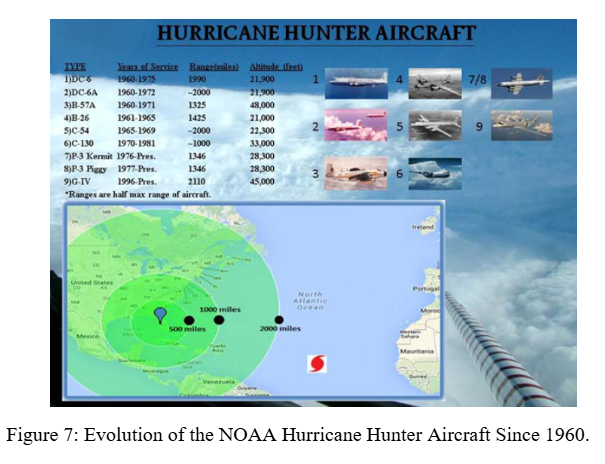
As shown in Figure 6, NOAA’s Aircraft Operations Center houses a fleet of specialized aircraft used for these missions. Figure 7 presents the historical evolution of hurricane hunter aircraft used since 1960, highlighting their range, altitude, and years of service, along with a map showing their monitoring coverage. Figure 8 illustrates the Tail Doppler Radar system on these aircraft, detailing its position and scanning area. This radar uses X-band frequency to measure wind fields at dual angles with a coverage radius of around 77 km, making it a vital tool for analyzing hurricane structure and intensity.
Aircraft reconnaissance is also important for broader emergency response and environmental monitoring, such as during Hurricanes Katrina and Sandy or events like the Deepwater Horizon oil spill (Collins & Flaherty, 2013)
Hurricane forecasting relies heavily on Numerical Weather Prediction (NWP) models, which use mathematical equations and real-time observations to simulate the atmosphere and predict weather conditions (Bauer, 2024; Kimura, 2002). These models vary in scale, accuracy, and resolution. Some of the most used models include:
Global Forecast System (GFS): Developed by NOAA, this model provides global forecasts up to 16 days in advance and is widely used for predicting large-scale weather patterns (Mukhopadhyay et al., 2019).
ECMWF Model: Created by the European Centre for Medium-Range Weather Forecasts, it is known for high accuracy in medium-range forecasting and integrates large amounts of observational data (Yang et al., 2022).
HWRF Model (Hurricane Weather Research and Forecasting): Specifically designed for tropical cyclones, this high-resolution model uses data from aircraft and satellites to improve predictions of storm track, intensity, and structure (Yablonsky et al., 2014).
These models can also be combined to estimate forecast uncertainty and provide a range of possible outcomes (Bauer, 2024).